 ORSTAC
Introduction
Curiosity-driven experimentation — not signal-chasing — is the single strongest predictor of whether an algo-trader persists or quits. Traders who treat DBot and backtesting as a laboratory for asking better questions survive the learning curve; those who treat them as a slot machine for signals abandon the craft within months. This article dissects the psychology behind that divergence using community data on failure rates, the “learning curve trap,” and the quantitative discipline that separates builders from gamblers.
Every developer-trader in the Telegram community eventually confronts the same fork in the road: keep asking questions, or keep hunting signals. The first path compounds knowledge; the second compounds frustration. Platforms like Deriv make the second path dangerously frictionless — a few clicks, a bot, a stake, a result. The frictionless path is the trap.
Trading involves risks, and you may lose your capital. Always use a demo account to test strategies.
The core thesis here is psychological but empirically grounded: the difference between a persistent algo-trader and a quitter is not talent, capital, or luck. It is the quality of the questions they ask their backtests. Curiosity, operationalized as structured experimentation, is the meta-skill. This article breaks that down into five actionable subthemes for programmers and traders building on the Orstac stack.
The Curiosity Loop vs. The Signal-Chasing Loop
The curiosity loop is a closed feedback cycle — hypothesis, backtest, measure, refine — that produces compounding skill. The signal-chasing loop is an open, dopamine-driven cycle — tip, trade, outcome, repeat — that produces compounding losses. Community failure-rate data consistently shows quitters cluster almost entirely in the second loop.
In the Orstac dev-trader community, a recurring pattern appears in the discussion threads: new members arrive asking “what settings for DBot?” rather than “how do I measure whether my settings are robust?” The first question has no durable answer. The second question generates a methodology. This distinction is documented in the community’s own experimentation logs on GitHub, where persistent members show a visible evolution from parameter-tweaking to hypothesis-testing.
The psychology here maps to Carol Dweck’s growth-mindset research and to Anders Ericsson’s deliberate-practice framework: skill emerges from targeted, feedback-rich repetition, not from volume of activity. A trader who runs 500 unexamined DBot sessions learns less than one who runs 20 backtests with explicit hypotheses and recorded outcomes. The Deriv demo environment is the ideal laboratory for the second approach — zero capital risk, full methodological rigor.
Practically, the curiosity loop looks like this in code:
import ccxt
import pandas as pd

exchange = ccxt.deriv()
ohlcv = exchange.fetch_ohlcv('BTC/USD', timeframe='1h', limit=5000)
df = pd.DataFrame(ohlcv, columns=['ts', 'open', 'high', 'low', 'close', 'volume'])

# Hypothesis: mean-reversion on 2-sigma deviations
df['ma'] = df['close'].rolling(50).mean()
df['sd'] = df['close'].rolling(50).std()
df['z'] = (df['close'] - df['ma']) / df['sd']

# Measure the edge, don't just trade it
df['fwd_ret'] = df['close'].pct_change().shift(-1)
print(df.groupby(pd.cut(df['z'], bins=5))['fwd_ret'].mean())
That snippet is a question, not a signal. It asks: “Does forward return differ meaningfully by z-score bucket?” The answer determines whether the hypothesis survives. This is the curiosity loop operationalized.
The Learning Curve Trap: Why Most Quit at the Worst Moment
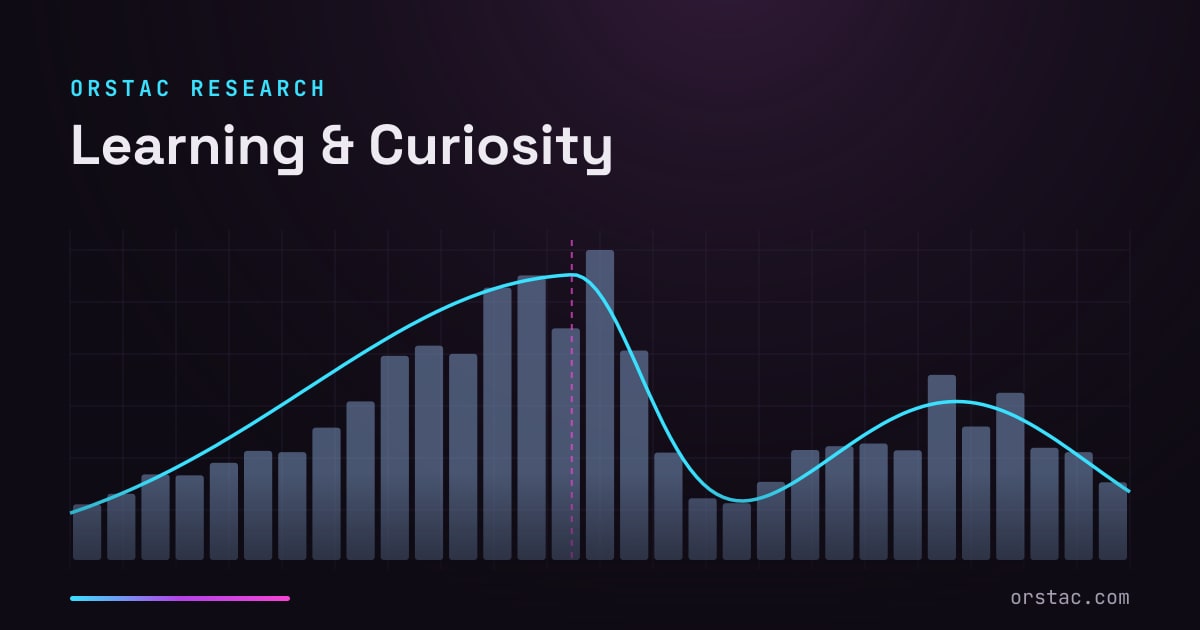
The learning curve trap is the psychological valley between early beginner’s luck and genuine competence, where drawdowns, complexity, and self-doubt peak simultaneously — and where the majority of algo-traders abandon the craft. Community failure-rate data shows attrition concentrates precisely in this valley, not at the start.
The trap has a recognizable shape. Early DBot experiments often “work” by chance — small samples, favorable regimes, survivorship bias in what the trader chooses to remember. Then the trader scales up, the sample grows, and the strategy’s true expectancy reveals itself. This is the statistical inevitability Benoit Mandelbrot described in The (Mis)Behavior of Markets: markets are fat-tailed and non-stationary, and naive backtests systematically understate tail risk.
The trap is compounded by what Marcos López de Prado calls “backtest overfitting” in Advances in Financial Machine Learning. A trader who tests 200 DBot configurations and picks the best one has not found an edge — they have found noise. The learning curve trap is partly a statistical trap and partly an emotional one: the same overfitted result that thrills the beginner is the one that destroys them at scale.
“Backtesting is not a research tool. Feature importance is not a research tool. The only true test of a strategy is its out-of-sample performance.” — Marcos López de Prado, Advances in Financial Machine Learning (2018). See related discussion at GitHub.
The community insight that matters most here: quitters quit because they interpret the trap as evidence of personal failure, rather than as evidence of a methodological gap. Persistent traders interpret the same drawdown as a signal to ask a better question — “Is my sample large enough? Is my regime assumption valid? Am I overfitting?” The trap is survivable if reframed as curriculum.
Quantitative Discipline: From Gambling to Engineering
Quantitative discipline converts trading from a probability gamble into an engineering problem by formalizing position sizing, regime detection, and risk of ruin. The Kelly Criterion, Ornstein-Uhlenbeck mean-reversion, and stochastic volatility models are not academic decoration — they are the tools that make curiosity productive rather than merely enthusiastic.
The Kelly Criterion, formalized by J.L. Kelly Jr. in 1956, gives the growth-optimal fraction of capital to risk given an edge and odds. Its practical lesson for DBot users is humbling: even a genuine edge, sized too large, guarantees ruin. Most community blowups trace to over-sizing, not bad signals.
def kelly_fraction(win_prob, win_loss_ratio):
    # f* = p - (1-p)/b
    return win_prob - (1 - win_prob) / win_loss_ratio

# Example: 55% win rate, 1:1 payoff
print(kelly_fraction(0.55, 1.0))  # 0.10 => risk 10% of capital (use fractional Kelly in practice)
For mean-reversion strategies — the backbone of most DBot configurations — the Ornstein-Uhlenbeck process provides the correct mathematical frame: a continuous-time model of a price series pulled toward a long-run mean with a mean-reversion speed parameter. Estimating that speed tells you whether a reversion trade has a time horizon compatible with your holding period.
“The most important thing is to have a robust methodology. A strategy that works in one regime and fails in another is not a strategy — it is a coincidence.” — Ernest P. Chan, Quantitative Trading (2009). Methodology notes mirrored at GitHub.
Stochastic volatility models (Heston, SABR) matter because they formalize what the learning curve trap exploits: volatility clusters and regimes shift. A backtest that assumes constant volatility will pass in calm regimes and fail catastrophically in stressed ones. Persistent traders test across regimes — bull, bear, high-vol, low-vol — before trusting a DBot configuration.
Modern 2026 Stacks: CCXT, Pandas, Node-RED, And AI Agents
The modern 2026 algo-trading stack separates signal generation, execution, and risk management into modular, testable layers — CCXT for exchange integration, Pandas/TA-Lib for indicators, Node-RED for flow orchestration, and prompt-engineered AI agents for sentiment and signal analysis. Modularity is what makes curiosity cheap: you can swap one layer without rewriting the whole system.
A practical 2026 architecture for an Orstac-style bot looks like this:
- Data layer: CCXT unified API pulls OHLCV and order-book data across exchanges; Pandas and TA-Lib compute indicators (RSI, Bollinger, ATR) reproducibly.
- Signal layer: A hypothesis-driven module that outputs a probability, not a binary buy/sell, so downstream risk logic can size positions.
- Execution layer: Node-RED flows orchestrate order placement, retries, and kill-switches visually and auditably.
- Risk layer: Kelly-fractional sizing with hard drawdown caps and regime-aware exposure limits.
- AI layer: A prompt-engineered agent that ingests news/sentiment and outputs a structured JSON signal, never a free-text trade command.
Prompt engineering is the newest discipline here. A well-designed prompt for a sentiment agent looks like this:
You are a market-sentiment classifier. Given the following news headlines,
return ONLY valid JSON with fields: sentiment (-1 to 1), confidence (0 to 1),
regime_hint ("risk_on" | "risk_off" | "neutral"), and rationale (<=20 words).
Do not output trade instructions. Headlines: {headlines}
The constraint that the agent outputs classification, not commands, is deliberate: it keeps the human (or the risk layer) in the decision seat and makes the agent’s output backtestable. This is the curiosity loop extended into natural-language models — you are asking the model a measurable question, not delegating your judgment.
Asking Better Questions: The Meta-Skill That Beats Signals
Asking better questions beats chasing signals because questions compound into frameworks while signals decay into noise. A trader who asks “what is my edge, how do I measure it, and under what conditions does it break?” builds durable infrastructure; a trader who asks “what should I buy?” builds dependency.
The community’s most persistent members converge on a question hierarchy that maps cleanly to quantitative practice:
- Descriptive: What does the data actually show? (Exploratory backtest, no trading.)
- Diagnostic: Why does this pattern exist — microstructure, flow, regime?
- Predictive: Does the pattern hold out-of-sample and across regimes?
- Prescriptive: What position size and stop logic make this survive ruin risk?
Each level requires different tools — Pandas for descriptive, regime analysis for diagnostic, walk-forward validation for predictive, Kelly and drawdown math for prescriptive. The hierarchy is the antidote to the learning curve trap because it gives the trader a visible map of progress: even a failed hypothesis advances you to level two. Failure becomes information, not identity.
“The goal is not to predict the future. The goal is to build a system that performs well across the distribution of possible futures.” — Ernest P. Chan, Algorithmic Trading (2013). Extended reading and community notes at GitHub.
This is why curiosity-driven experimentation separates persistent traders from quitters. The quitter asks “did I win?” and stops when the answer is no. The persistent trader asks “what did I learn?” and continues because the answer is always something.
Comparison Table: Psychology Of Learning In Algo-Trading
| Dimension | Signal-Chaser | Curiosity-Driven Experimenter | Quantitative Engineer |
|---|---|---|---|
| Primary question | “What should I trade?” | “What does the data show?” | “Is this edge robust out-of-sample?” |
| Tooling focus | Prebuilt DBot presets | Pandas + exploratory backtests | CCXT + Node-RED + walk-forward validation |
| Response to drawdown | Abandon strategy, chase new signal | Hypothesize cause, redesign test | Adjust sizing, re-check regime assumptions |
| Failure interpretation | Personal failure | Information gain | Methodology gap to fix |
| Expected survival | Low (exits in learning curve trap) | Medium-High (compounds skill) | High (systematic edge) |
Frequently Asked Questions
What is the learning curve trap in algo-trading?
The learning curve trap is the psychological valley between beginner’s luck and genuine competence, where drawdowns and complexity peak and most traders quit. It is survivable by reframing failure as curriculum rather than identity.
What is the Kelly Criterion and why does it matter for DBot users?
The Kelly Criterion is a formula (f* = p − (1−p)/b) that gives the growth-optimal fraction of capital to risk given an edge. It matters because most community blowups come from over-sizing a real edge, not from bad signals.
What is the Ornstein-Uhlenbeck process used for in trading?
The Ornstein-Uhlenbeck process is a continuous-time mean-reversion model that estimates how quickly a price series returns to its long-run mean. It tells mean-reversion traders whether their holding period is compatible with the reversion speed.
What is backtest overfitting and how do I avoid it?
Backtest overfitting is the practice of testing many configurations and selecting the best-performing one, which captures noise rather than edge. Avoid it with walk-forward validation, out-of-sample testing, and limiting the number of configurations tested.
How does prompt engineering improve AI trading agents?
Prompt engineering improves AI trading agents by constraining their outputs to structured, backtestable classifications (JSON sentiment scores, regime hints) rather than free-text trade commands, keeping risk decisions with the human or risk layer.
Conclusion
The psychology of learning in algo-trading reduces to one durable insight: persistent traders are not those who found better signals — they are those who asked better questions and built systems to answer them. The learning curve trap is real, and community failure-rate data confirms it claims most newcomers. But it is a statistical and emotional trap, not a talent trap. Curiosity, operationalized as structured experimentation with DBot, backtesting, and modern 2026 stacks — CCXT, Pandas, Node-RED, prompt-engineered AI agents — converts the trap into a curriculum. Kelly sizing, Ornstein-Uhlenbeck reversion analysis, regime-aware stochastic volatility modeling, and out-of-sample discipline are the tools that make curiosity productive rather than merely enthusiastic.
Start on Deriv with a demo account, log your hypotheses, and measure your questions as rigorously as your trades. Explore the broader Orstac ecosystem at Orstac. Join the discussion at GitHub.
Trading involves risks, and you may lose your capital. Always use a demo account to test strategies.